Introduction
A primary focus of this research log is to experiment with legal forecasting using recent transformer-based models. This page documents the methodology and validation of the model. This page may update with improvements in the model. (I use “model” permissively to include the pipeline from raw data to inference and ensembling.) The current model is called experience-5, in a nod to Holmes. Experience-5 is a modest revision over experience-4, designed to improve vote aggregation and estimates of uncertainty; classification performance is approximately unchanged and not updated. (Updated 11-17-25.)Basic Approach
The objective of the model development is to learn the justices’ personalities and preferences. To do so, I experiment with signals from party filings, lower court decisions, oral argument, and amicus briefs, and train large-parameter open-weight models. For the validation exercise reported here, I trained on data from terms since Justice Kagan took her seat but stopped in OT2023. This allows us to evaluate model performance against OT2024, the term that wrapped up in June 2025. Information can leak across cases within terms, and it is important to validate against data that is temporally cordoned from the training data rather than use standard cross validation.Benchmark Performance
It is notoriously difficult to predict Supreme Court votes. The leading algorithmic approaches produce vote-level predictions with about 70 percent accuracy. Wisdom of human crowds tends to be higher—about 80 percent accuracy. But case-level predictions tend to be lower. For example, last term (OT2024) the human crowds predicted vote outcomes with an accuracy of 80.6 percent, but case-level outcomes with an accuracy of only 76.3 percent. Both the algorithmic and human results include near-decision information, such as oral argument data, amicus briefs, etc. The main model I develop uses most near-decision information, too. However, I only use features available up to the day of oral argument. This means that I exclude information that others include, perhaps most notably the timing of the decision itself. For my prediction objectives, I view that information as a kind of leakage—the timing of the decision may be endogenous to characteristics we are trying to model (e.g., politically charged cases may be decided later in the term).Validation
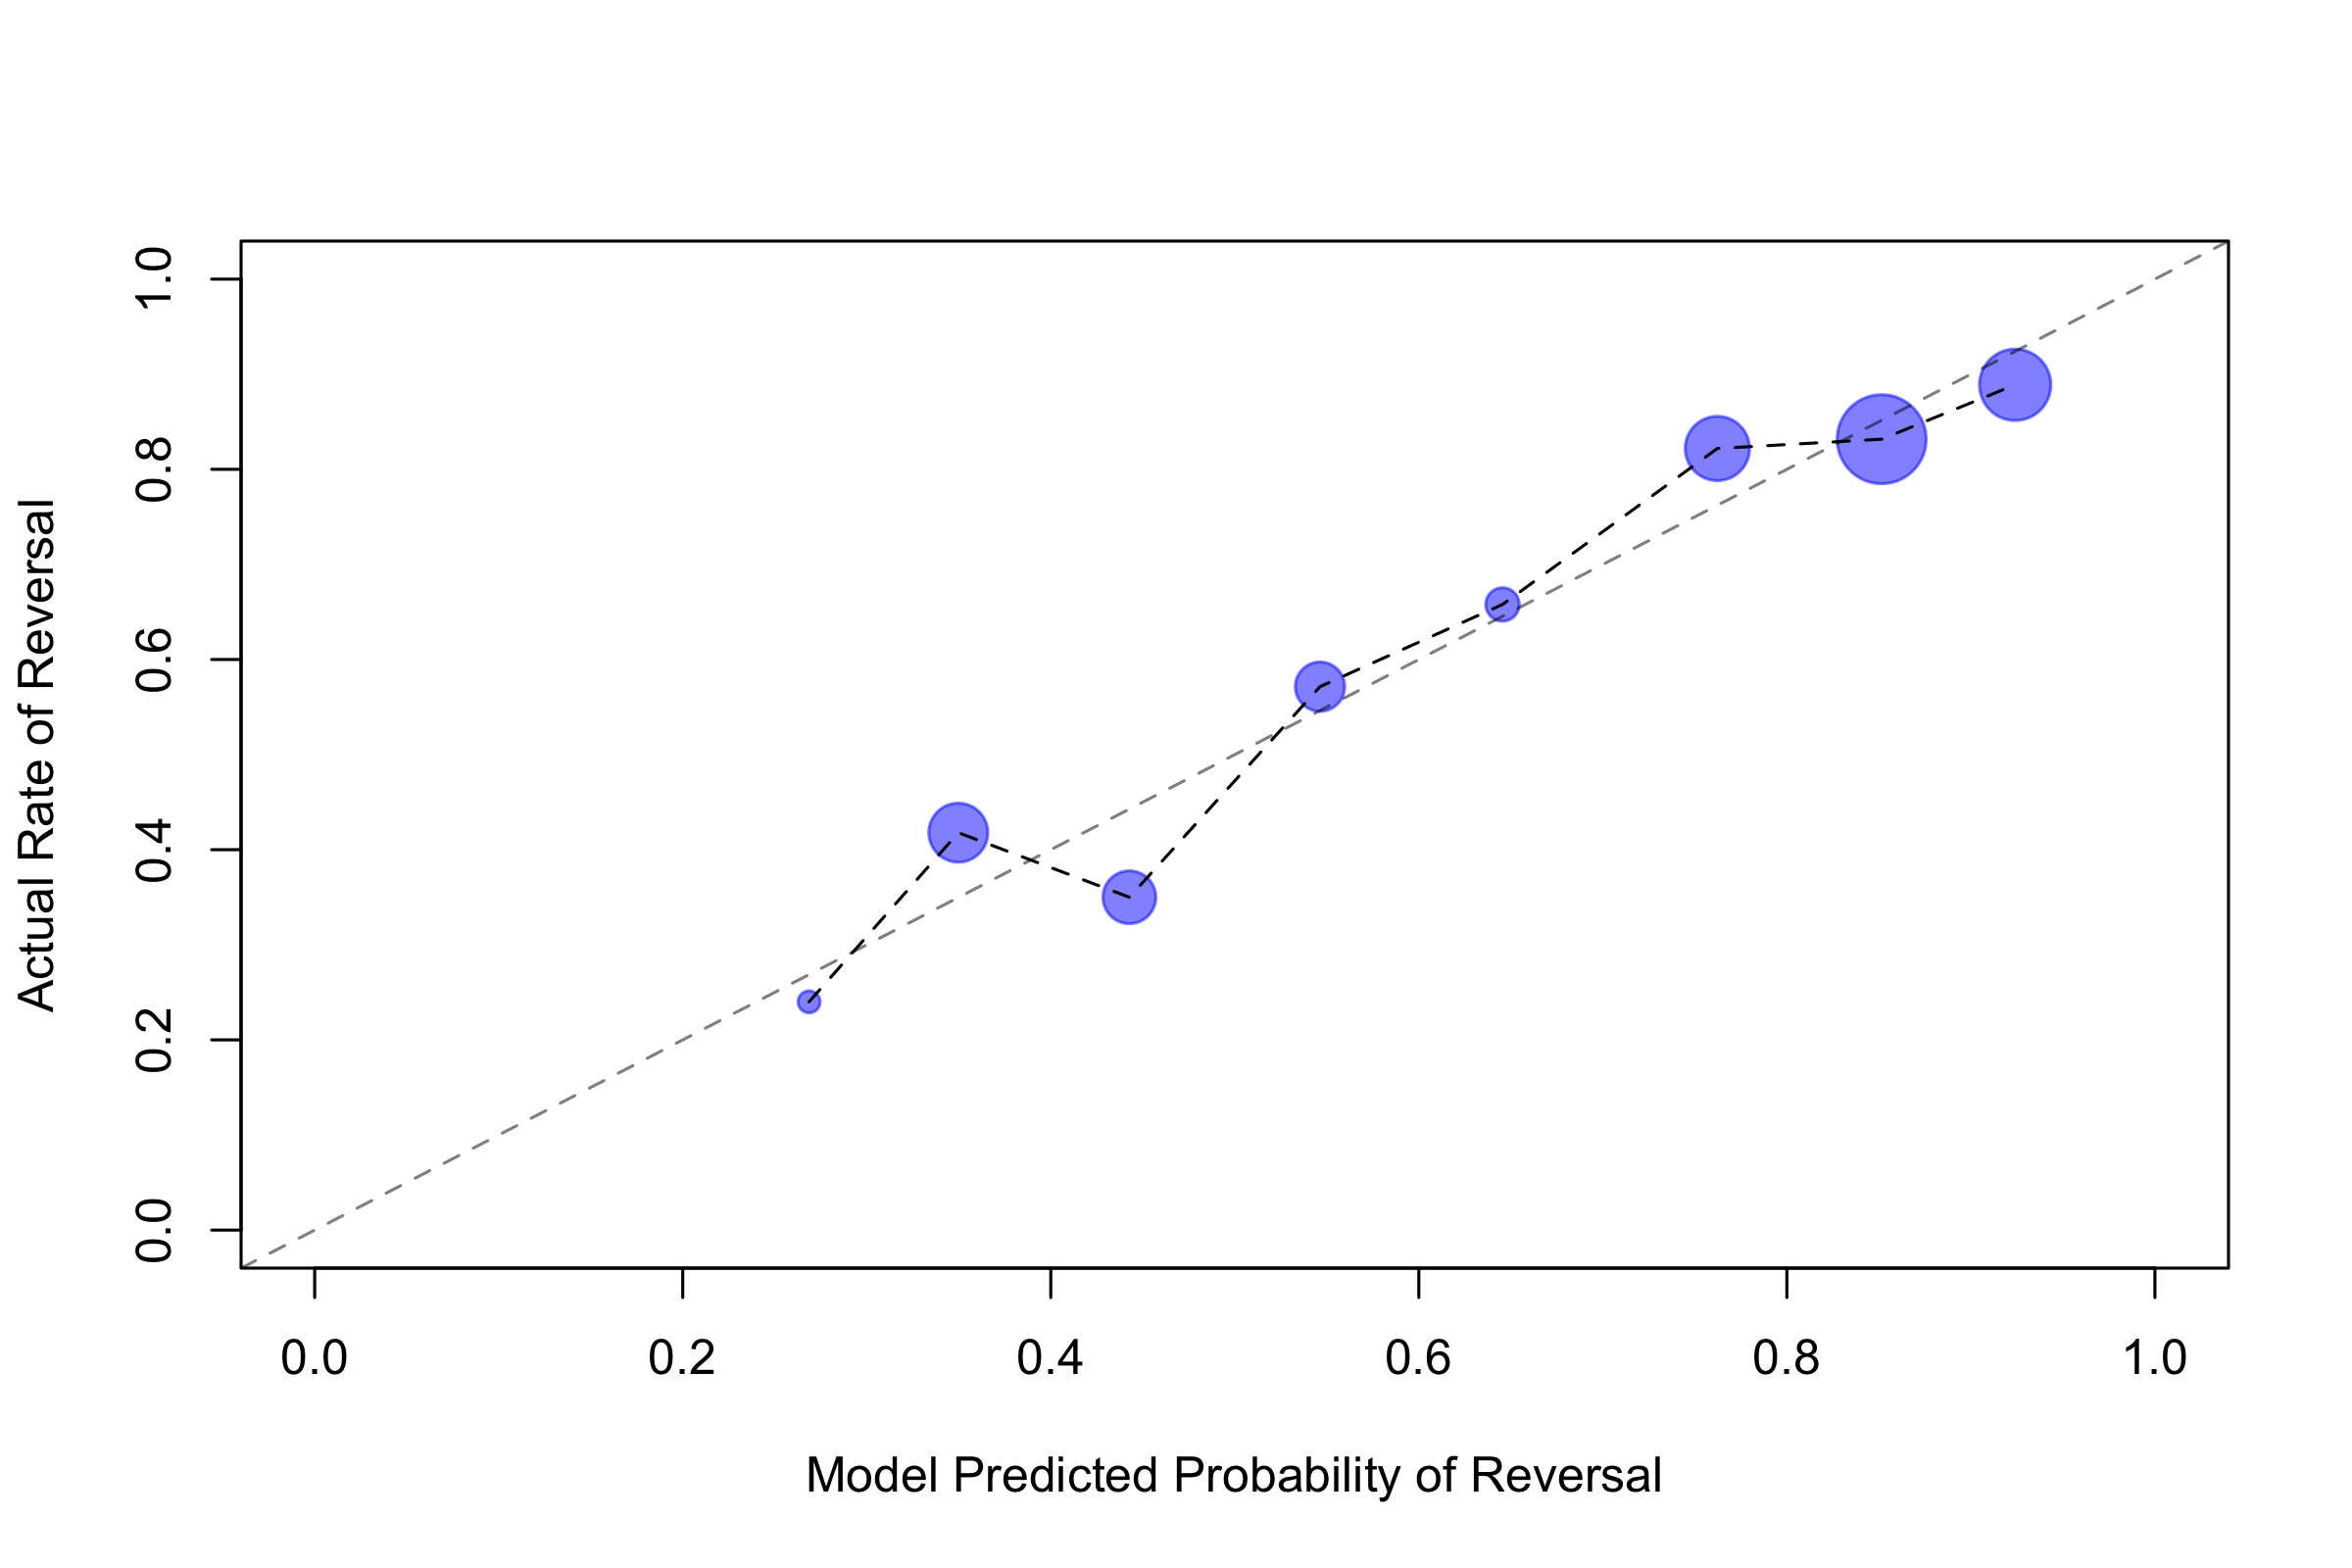
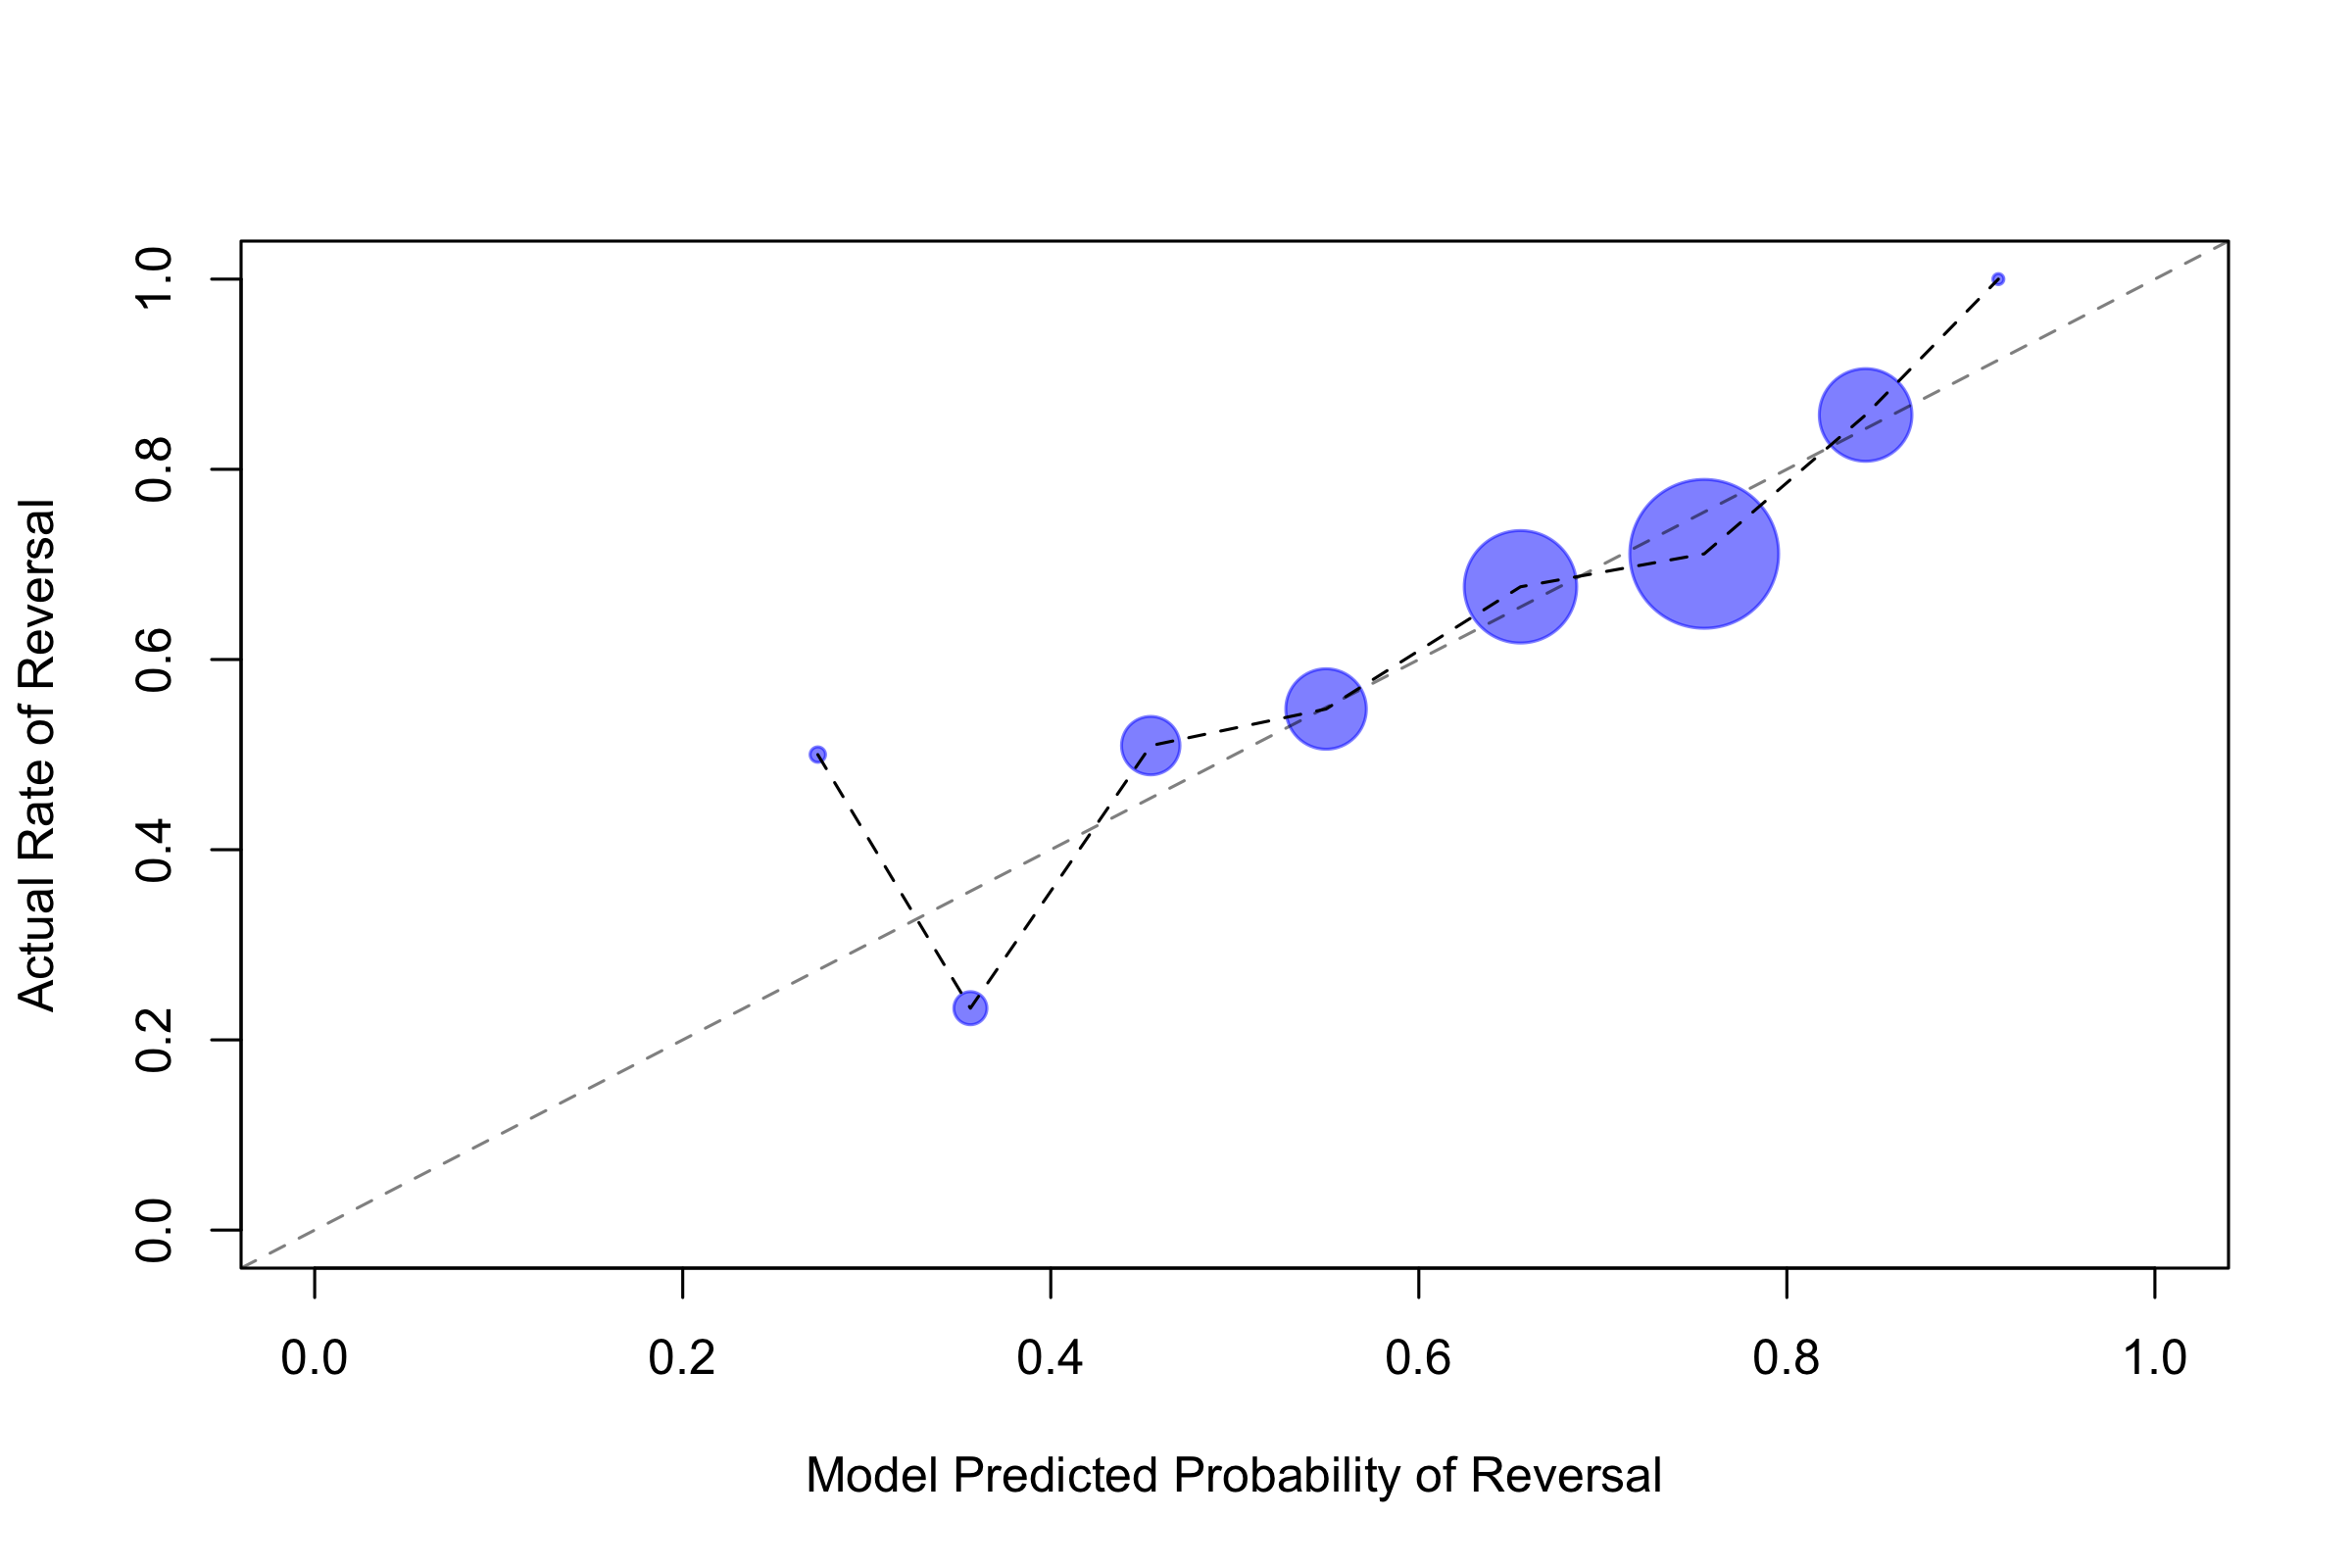
Model performance is validated against a hold-out term, OT2024. This is the term that wrapped up in June 2025. Performance on this test term will provide a useful assessment of how the model will perform on the current term. (Note that for the current term predictions, I nudge training forward to include data from last term.) The results for OT2024 are reported in the tables below. The model’s vote-level accuracy is 74 percent, and its case-level accuracy is 82 percent. Vote-level accuracy higher than algorithmic SOTA but lower than human crowds. At the case level, the model outperforms algorithmic SOTA and humans. It is common to assess performance using the F1 score, along with recall and precision. Recall is the proportion of positive instances correctly identified; and precision tells us the proportion of cases the model marks as true are in fact true. Together, they give a measure of false positives and negatives, and the F1 score is the (harmonic) average of the two. Overall, at the vote level, F1 score is 0.74 when weighted by class frequency and 0.71 when unweighted by frequency. The affirm class is more difficult to predict and that shows up in the table through a lower F1 score.| Class | Precision | Recall | F1 | Support |
|---|---|---|---|---|
| Affirm | 0.64 | 0.58 | 0.61 | 173 |
| Reverse | 0.79 | 0.83 | 0.81 | 328 |
| Macro (weighted) | 0.75 | |||
| Macro (unweighted) | 0.71 | |||
| Accuracy | 0.74 |
Table 1: vote level performance
| Class | Precision | Recall | F1 | Support |
|---|---|---|---|---|
| Affirm | 0.78 | 0.47 | 0.58 | 173 |
| Reverse | 0.83 | 0.95 | 0.89 | 328 |
| Macro (weighted) | 0.81 | |||
| Macro (unweighted) | 0.73 | |||
| Accuracy | 0.82 |
Table 2: case level performance
Ablation—Without Oral Arguments
The validation results reported earlier reflect the main model, with near-decision information including oral argument. I also investigate a minimalistic model that includes information that would be available for all cases before the term officially starts. The model includes less useful information, so we would expect it to perform worse. But often it will be of interest to know what a case’s prospects would be even if we do not have oral argument data. Using again a version of the model trained on data through OT2023, and evaluating against OT2024, table 3 reports the vote-level results for this minimalistic model. As is evident, model performance is in fact worse without near-decision information. However, performance remains generally respectable, roughly approximating or edging out that of the SOTA algorithmic models. Overall accuracy was 69 percent, with a weighted (unweighted) F1 score of 0.67 (0.61). The model performs worse on the affirm class, especially on recall.| Class | Precision | Recall | F1 | Support |
|---|---|---|---|---|
| Affirm | 0.59 | 0.35 | 0.44 | 173 |
| Reverse | 0.72 | 0.89 | 0.79 | 328 |
| Macro (weighted) | 0.67 | |||
| Macro (unweighted) | 0.61 | |||
| Accuracy | 0.69 |
Table 3: vote level performance (wo argument)
| Class | Precision | Recall | F1 | Support |
|---|---|---|---|---|
| Affirm | 0.8 | 0.27 | 0.4 | 173 |
| Reverse | 0.79 | 0.98 | 0.87 | 328 |
| Macro (weighted) | 0.74 | |||
| Macro (unweighted) | 0.63 | |||
| Accuracy | 0.79 |
Table 4: case level performance (wo argument)
Uncertainty
Uncertainty over votes (and case outcomes) can be viewed in different ways. If a vote is predicted to be reverse with 51 percent, that can be considered as uncertain, even if we are very certain that of the probability of reversal. And if a vote is predicted to be reverse with 99 percent, that too can be considered uncertain, if we are very uncertain of the probability of reversal. The former type of uncertainty is easy enough to process and calculate—intuitively, we know that outcomes are more uncertain with a fair coin than with a weighted coin. The latter form of uncertainty is more difficult—it requires us to assess our confidence in the predictions themselves. How sure are we that this is a weighted coin? The model training process itself reveals how certain the model is of its outputs—more certain predictions vary less in output—and that can be used as a principled measure uncertainty. (I will post more details about that some time.) And this measure of uncertainty can be adjusted to match quantities we might care about. I adjust uncertainty so that we cover 90 percent of true votes and case outcomes with the uncertainty bands (using a rule of a reversal vote/outcome if the probability of a reversal vote/outcome is greater than 50 percent). In other words, for example, if the lower bound of the band is above 50 percent, there should be a 90 percent chance the vote/outcome is to reverse.Limitations
The model performs well relative to benchmarks on OT2024. However, this is a difficult task and there are limits in model performance. Here are some of the main limitations:- Drift. It is possible that the features that are predictive of the Court’s behavior will change over time. This could be because the docket changes, the composition of the Court changes, or the decision environment changes.
- Generalizability. Even without drift, it is possible that OT2024 is unrepresentative of the Court’s behavior in the current term. The Court’s behavior may be more similar to OT2023 or OT2019.
- Data quality and availability. The model’s performance depends on the quality and completeness of the underlying data sources (party filings, lower court decisions, oral arguments, amicus briefs). Missing or incomplete data could significantly impact predictions.
- External factors. The model may not adequately capture external factors that influence Court decisions, such as public opinion, political pressure, or broader social and economic contexts.
- Explainability. The models used contain tens or hundreds of billions of parameters and it is therefore difficult to interpret or explain model outputs. Part of this research exercise is to pair the model predictions with close readings of the underlying material.