The Court has issued its final decisions for the merits docket and it’s time to take stock of model performance. Overall, the model did about as well as it did in the validation term, a shade worse on several measures, slightly better on one or two. A more detailed error analysis and comparison with human predictions will be forthcoming.
Vote-level results
Vote level accuracy was 73 percent. The Macro F1 score was 0.71 (0.72 weighted). As in the validation set, performance was substantially worse for the (minority) affirm class, with recall especially suffering.
Precision
Recall
F1
Support
Affirm
0.71
0.58
0.64
210
Reverse
0.73
0.83
0.78
293
Macro-F1
0.71
Macro-F1 (weighted)
0.72
vote level performance
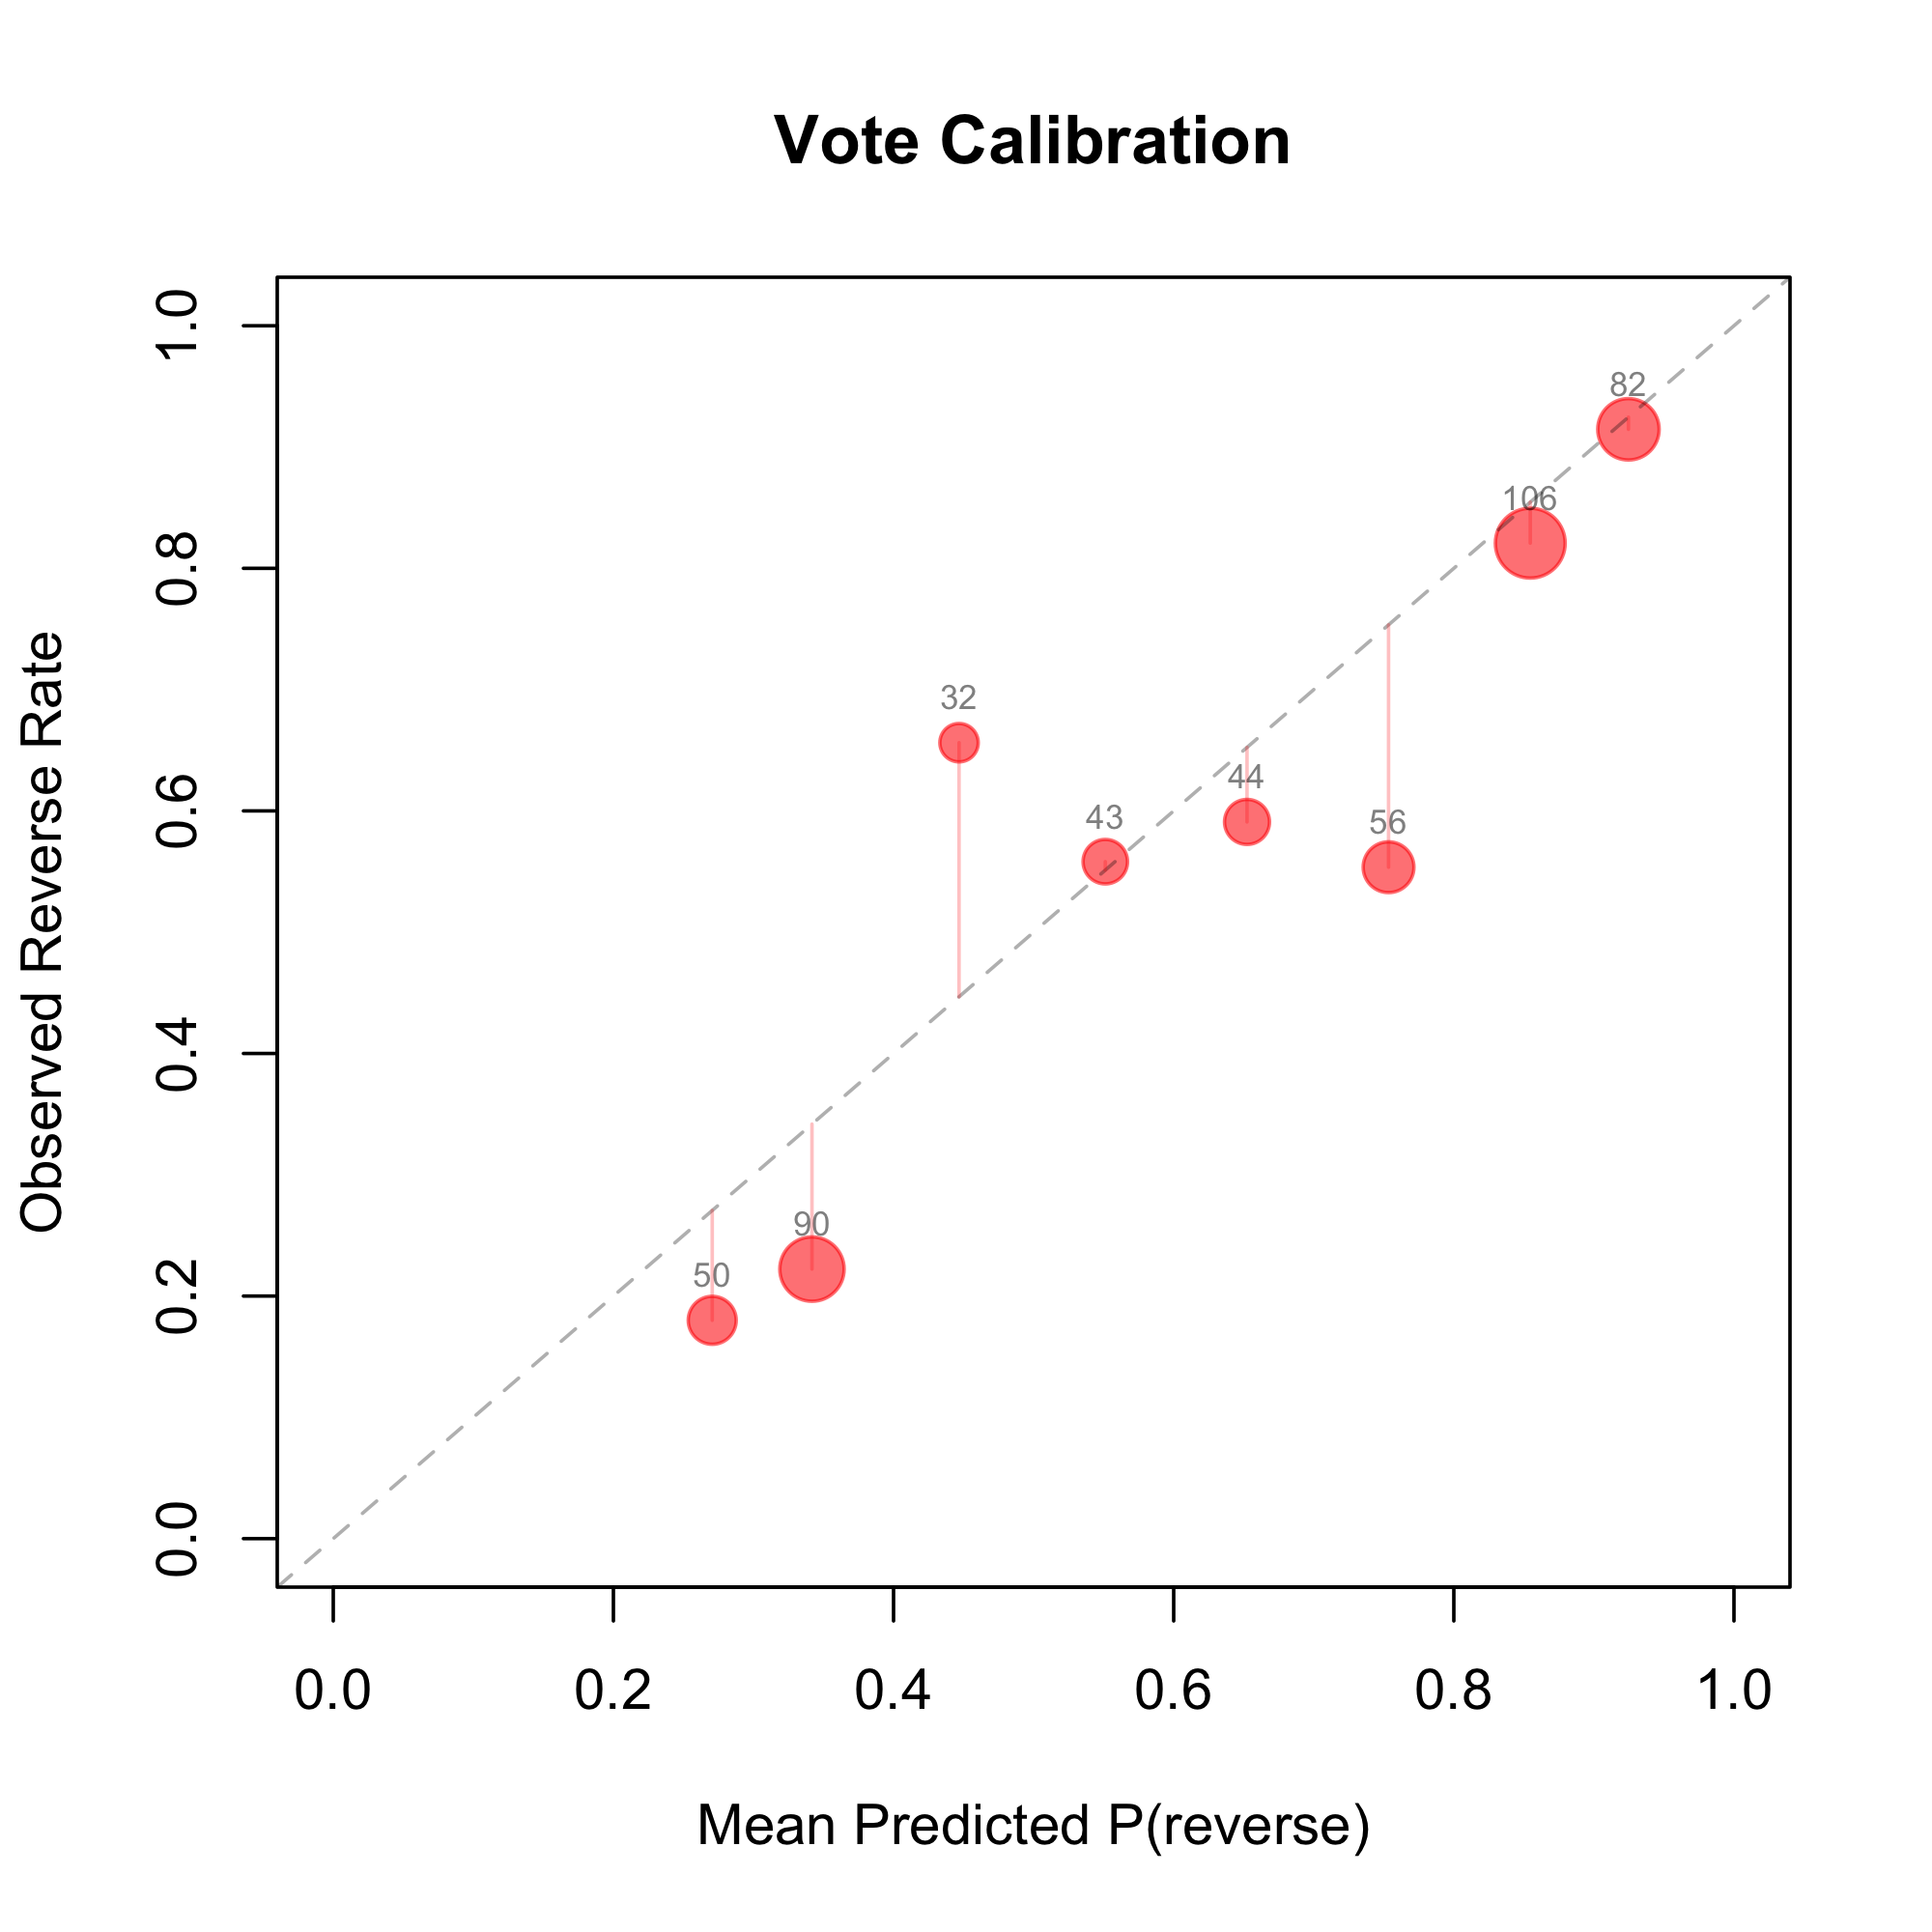
Calibration is also strong. The Brier score was 0.18, the same as in the validation set. The expected calibration error (ECE) —a measure of how well-tuned model confidence is—is 0.08. This means that, if the model says the odds of reverse are X percent, on average, it is off by 8 percentage points. That is a few percentage points higher than model performance in the validation set, but respectable. Figure 1 plots the calibration results.
vote level calibration
Also of note, our measure of uncertainty is tuned about correctly. It was designed so that the uncertainty bands should cover the true vote outcome 90 percent of the time. For example, if the model predicts reverse, but the true vote is affirm, the uncertainty bands should indicate a possibility of affirm 90 percent of the time; and just the other way for incorrect affirm predictions. Thus, if the model predicts reverse with probability 0.53, the uncertainty bands may dip below 0.5, which indicates that the model is unsure of that prediction. The fraction of confident errors—where the model is wrong without covering the correct vote in its bands—should be about ten percent of all votes.
On this dimension, the model again performs about as expected. The fraction of confident errors was 13 percent. The model was either correct, or appropriately indicated uncertainty, in 87 percent of cases.
Case-level results
As in validation, case level accuracy is higher than vote level accuracy. Case level accuracy was 75 percent. Case accuracy is lower than in the validation set by about 7 percentage points, though the number of cases is small and that difference amounts to 3-4 cases. The Macro F1 score was 0.68 (0.73 weighted). Again as in the validation set, performance was substantially worse for the (minority) affirm class, again especially on recall.
Precision
Recall
F1
Support
Affirm
0.67
0.44
0.53
18
Reverse
0.77
0.89
0.83
38
Macro-F1
0.68
F1 (weighted)
0.73
case level performance
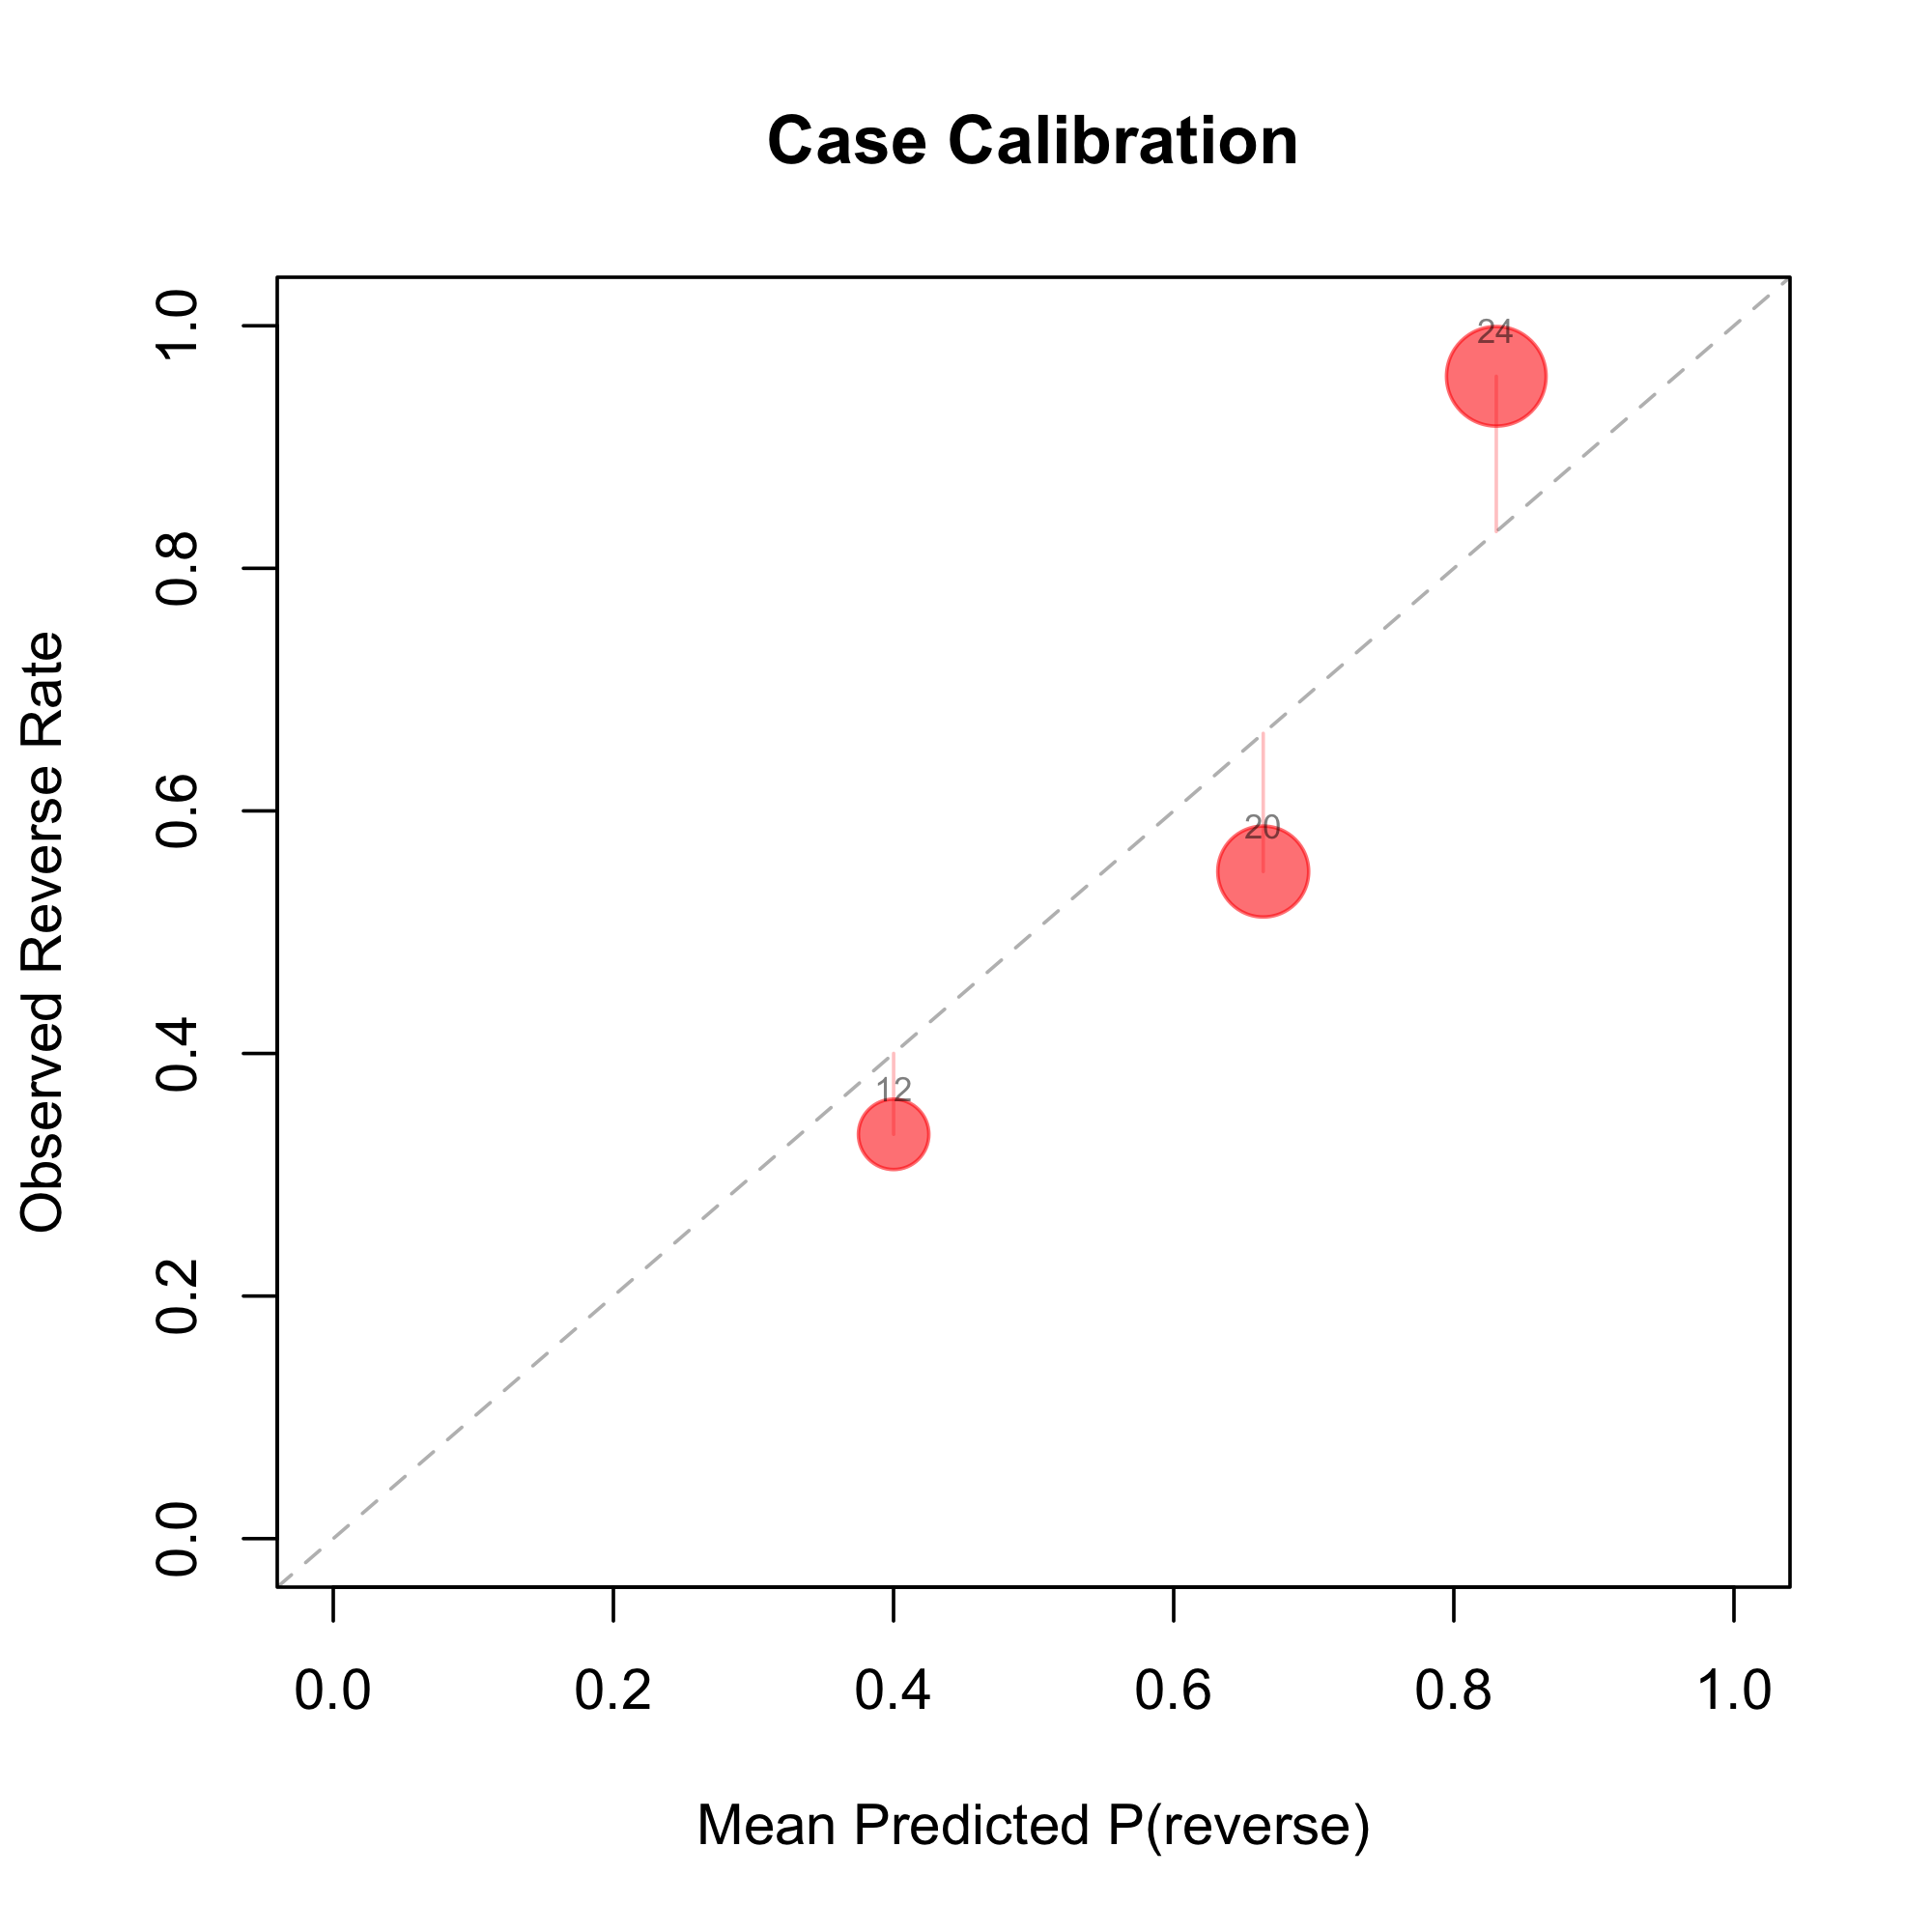
Case level calibration resembles the vote level calibration. The Brier score was 0.16 and the ECE was 0.09. That is actually slightly better than in the validation set, though again the small number of cases should be kept in mind. Figure 2 plots the corresponding calibration results.
case level calibration
The uncertainty measure travels well to the case level. It again was designed so that the uncertainty bands should cover the correct outcome 90 percent of the time; only 10 percent of cases should be confident wrongs. That is about what we observed in the live predictions. The model was either correct, or appropriately indicated uncertainty, in 86 percent of cases.
Conclusion
Overall, the model did about as expected in this live term. The model edges out existing published algorithmic Supreme Court prediction performance. Soon I will post an error analysis and comparison with the humans (who did quite well this term).