Update 11/1/25:
See the methods page for current model.
Initial post:
It is notoriously difficult to predict Supreme Court votes. The leading algorithmic approaches produce vote-level predictions with about 70 percent accuracy. Wisdom of human crowds tends to be higher—about 80 percent accuracy. Case-level predictions tend to be lower. For example, last term (OT2024) the human crowds predicted vote outcomes with an accuracy of 80.6 percent, but case-level outcomes with an accuracy of 76.3 percent. Both the algorithmic and human results include near-decision information, such as oral argument data, amicus briefs, etc.
This is a difficult task for a few reasons. First, law is very high-dimensional and it is challenging to capture the features relevant to decisions without also capturing features that introduce noise and degrade model performance. Here, I use “model” permissively, including human models of justice decision-making. Second, as the Court is at the top of the judicial hierarchy, the cases that it hears tend to the most complex, often pitting one valid signal against other valid signals (e.g., a conflict between precedents or legal provisions). The resolution of those clashing signals is the Court’s job, and it will typically be unclear a priori what the resolution will be. Prominent theories of litigation, indeed, predict that we only observe uncertain cases—if they were certain, parties would save resources and settle. Third, the Court and composition of cases changes over time, and it can be difficult to capture that temporal drift.
Despite these challenges, I wanted to see what kind of performance would be produced by newer models adapted to the legal domain. I experimented with a variety of models and approaches, but for now landed on using signals from the party filings, oral argument, and amicus briefs, and trained adapters on Llama 70b models for the task of predicting votes. I produced the feature set from those raw inputs and aimed to maximize the signal/noise ratio. The resulting justice bots will take information from a new case and predict how a given justice will vote on it.
I trained on terms since Justice Kagan took her seat but stopped in OT2023. This allows us to evaluate model performance against OT2024, the term that wrapped up in June 2025. In this context, information can leak across cases within terms, and it is important to validate against data that is temporally cordoned from the training data rather than use standard cross validation.
How did the models do? Well, first, let me acknowledge again that this is a difficult problem. Even with modern language models, it is easy to underperform relative to SOTA.
But after pushing theoretically relevant features and carefully attending to best training practices, the model matched algorithmic SOTA at vote level accuracy (71 percent). More impressive, it bested the humans at case-level accuracy (79 percent).
It is common to assess performance using the F1 score, along with recall and precision. Recall is the proportion of positive instances correctly identified; and precision tells us the proportion of cases the model marks as true are in fact true. Together, they give a measure of false positives and negatives, and the F1 score is the (harmonic) average of the two. Overall, at the vote level, F1 score is 0.71 when weighted by class frequency and 0.67 when unweighted by frequency. The affirm class is more difficult to predict and that shows up in the table through a lower F1 score.
Class
Precision
Recall
F1
Support
Affirm
0.6
0.49
0.54
173
Reverse
0.76
0.83
0.79
328
Macro (weighted)
0.71
Macro (unweighted)
0.67
Vote-level performance
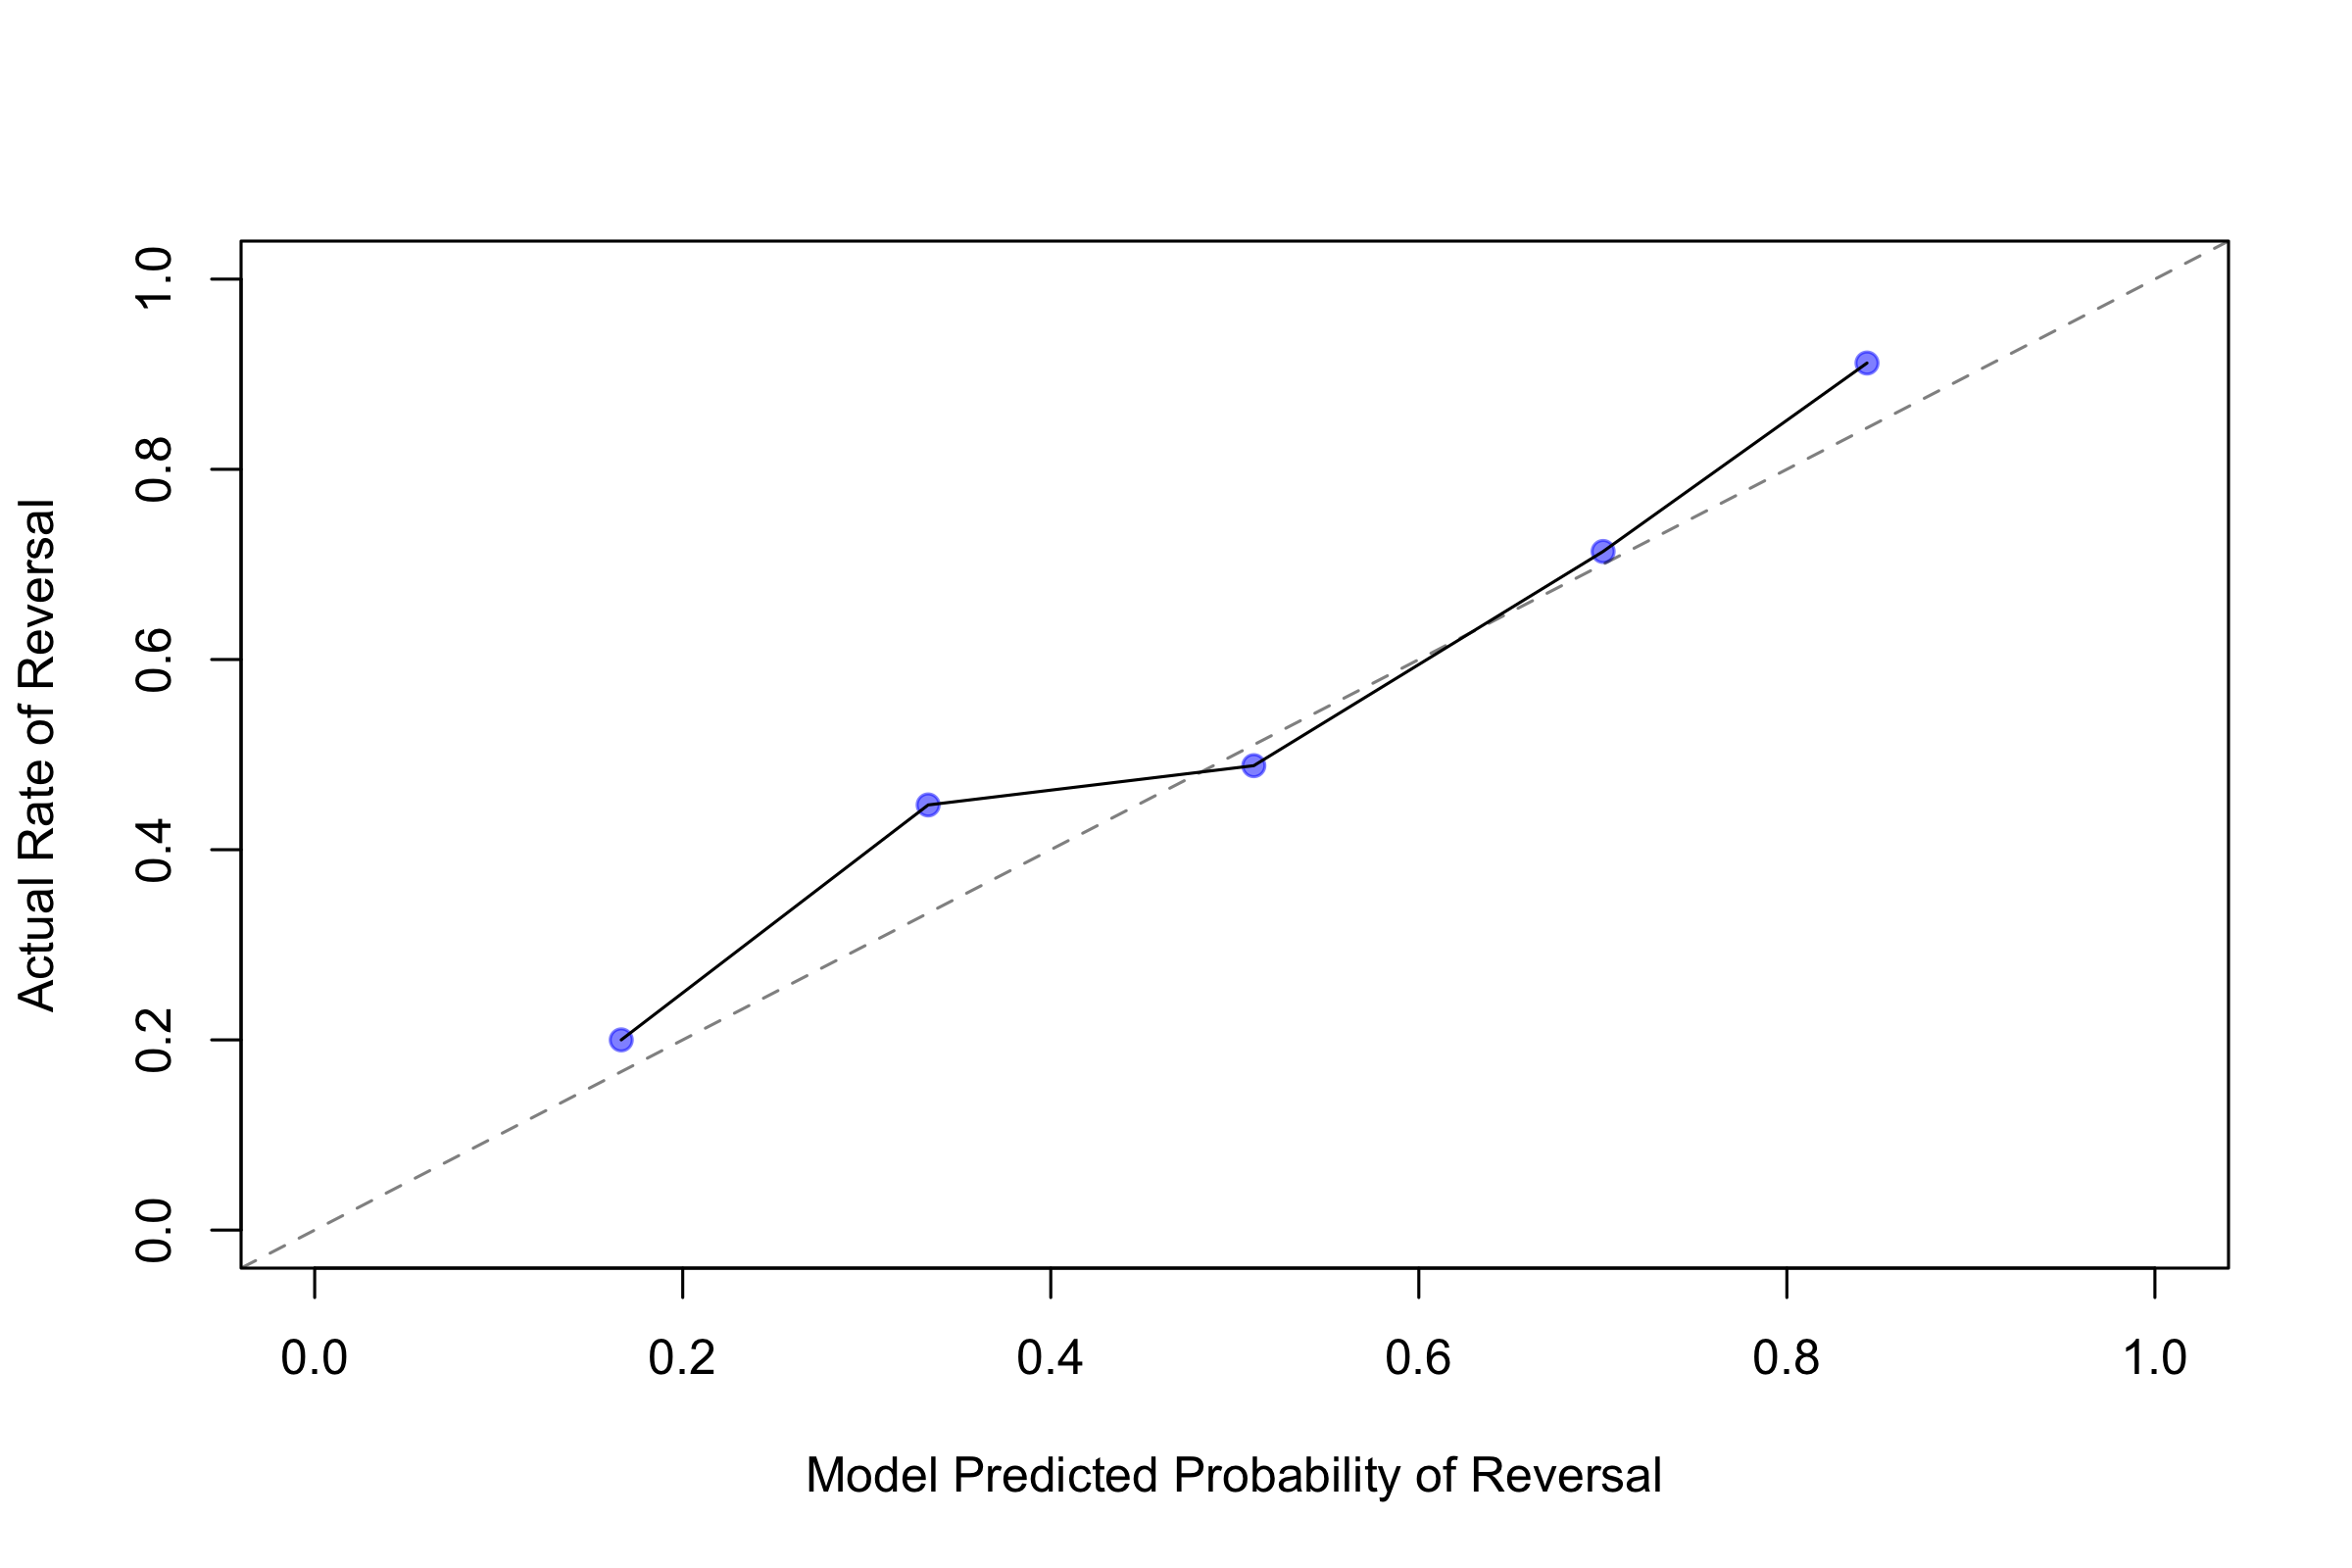
Also important, the model calibration appears reasonable. Calibration refers to the model’s ability to tell us how confident it is in its predictions. So if it says there is a fifty percent chance of an event, does the observed event happen fifty percent of the time? Figure 1 bins the predicted probabilities from the model for reversal and shows how often, within each bin, the vote turns out to be reversal. A perfectly calibrated model would have points for each bin exactly on the 45-degree angle line. The observed calibration is roughly along that line. The expected calibration error (ECE), or departure from the line of perfect correspondence, is 0.04—the average bin is about four percentage points off target. We can also look at the Brier score, which is the mean square of the difference of the label and the predicted probability. Lower is better. The model’s Brier score is 0.19. That can be used later to compare to other models.
Vote-level calibration
Unlike other models, including human models, this model appears better at the case level than the vote-level. I plan to post more on that later. But for now consider table 2, which reports model performance by class at the case level. All relevant measures are stronger at the case level than the vote level. On calibration, the ECE is somewhat worse (0.10) but the Brier score is somewhat stronger (0.17).
Class
Precision
Recall
F1
Support
Affirm
0.64
0.47
0.54
15
Reverse
0.82
0.9
0.86
41
Macro (weighted)
0.77
Macro (unweighted)
0.7
Case-level performance
I plan to investigate a variety of models in the coming posts. What happens if we drop oral arguments? Amicus data? What does the model predict for the current term?
Until soon.